
Forex trading offers a chance to profit from currency value changes. With over $6 trillion traded daily, it’s one of the most accessible markets. You can trade from anywhere using platforms like Meta Trader 4 or 5, starting with little capital. This guide covers the basics, key tools, and strategies to get you started in Forex trading, plus advanced tips for success.
What is Forex trading?
Forex trading (FX) is the act of buying and selling currencies to make a profit. This can now be done online using a phone or laptop. Over $6 trillion is traded daily in the global Forex market. No need for physical Forex bureaus anymore.
How can you make profit from forex trading?
For example, exchanging $100 for Kenyan Shillings can create profit if the currency value changes. Traders can start with as little as $50 and see big returns. Some people have turned $100 into $350, which is a 300% return. Others have made $600 from $3,000.
The simple strategy
- Start with a small amount.
- Use online platforms to trade.
Take advantage of daily currency fluctuations.
This can help grow profits quickly. But remember, results can vary.
Choosing the right broker and opening your account
To trade Forex, you need a broker. A broker helps you access the Forex market. When picking a broker, keep these points in mind:
- Regulation: Ensure the broker is regulated to protect your funds.
- Market Access: Choose a broker that gives you access to Forex, stocks, or crypto, depending on your interest.
- Initial Deposit: Go for brokers that let you start with a smaller deposit, like $50 or $100.
- Spreads and Fees: Look for brokers with low fees and tight spreads to keep your profits up.
Open the trading account
Now that you’ve picked a broker, it’s time to open your account. Here’s what you’ll do:
- First, give your country and email.
- Next, verify your identity using something like a national ID or passport. This prevents fraud.
- You can then choose between a demo account (to practice without real money) or a real account.
Practicing with a demo account
It’s best to use a demo account to practice before trading with real money. Use amounts similar to what you plan to trade with. For example, if you plan to start with $100, practice with that amount in the demo account.
Using trading platforms
When you’re ready to trade, use platforms like MT4 or MT5. You can also select leverage, such as 1:500, to manage your trades more effectively.
Currency pairs and leverage in forex trading
Realistic Practice Before Live Trading
The strategy encourages practicing with realistic settings before entering the live market. This helps traders understand how the market works without risking real money.
Learning currency pairs
Forex trading involves selling one currency and buying another in pairs. Here are the three main types of currency pairs:
- Major Pairs: These are the most traded and easiest to analyze. Examples include EUR/USD, GBP/USD, and USD/JPY. They are best for beginners.
- Cross Pairs: These pairs are made of major currencies but do not include the US dollar. Examples include AUD/CAD and AUD/JPY.
- Exotic Pairs: These involve currencies from emerging economies, such as USD/ZAR (US Dollar and South African Rand).
Key forex trading terms
To trade effectively, understanding basic trading terms is crucial. Here are some important terms:
- Ask Price: The price which is set by the broker at which a trader is willing to sell a currency.
- Bid Price: The price which is set by the broker at which a trader is willing to buy a currency.
- Spread: The difference/gap between the ask and bid prices.
Spread= ask -bid
Tight spreads benefit traders, while wider spreads favour the broker.
Understanding leverage
Leverage lets traders control bigger positions with a smaller initial deposit. For example, with Leverage of 1:500, a trader can trade larger amounts with only $100 in their account.
- How Leverage Works: If a trader uses Leverage of 1:100, with $100, their trading power becomes $10,000.
- Risk of Leverage: The higher the Leverage, the higher the risk. Some countries, like the US, regulate Leverage to protect traders from excessive losses.
Buying and selling in forex trading
Forex trading involves two key actions: buying (going long) and selling (going short).
- Buying (Going Long): When a trader buys a currency pair, they expect its value to rise (buy low, sell high).
- Selling (Going Short): When a trader sells a currency pair, they expect its value to fall (sell high, buy low).
Using analogies for better understanding
Think of bulls pushing prices up and bears pulling prices down. This analogy helps remember the concepts of going long (bullish) and going short (bearish).
Basic forex trading concepts: Buy, sell, risk management

Forex trading can be highly profitable, but effective risk management is key to success. Understanding how to buy and sell, along with using tools like Stop-Loss and Take Profit, helps traders manage risk effectively.
Stop-loss: Limiting losses
A Stop-Loss is an automatic order that closes a trade if the market moves against your prediction. Suppose you buy a currency pair and the price falls, the Stop-Loss will close the trade, preventing further losses. It’s important to set a Stop-Loss to protect your capital and minimize the risk of big losses.
Take profit: Locking in gains
A Take Profit order automatically closes your trade when the market hits your profit target. For example, if you buy and set a Take Profit, your trade will close as soon as the price reaches your goal. It’s a good way to lock in profits before the market might turn against you.
Risk management: How to manage risk
Using Stop-Loss and Take Profit orders is key for managing risk. They let you control your losses and lock in profits, so you’re not making decisions based on emotions or taking on too much risk.
Margin, used margin and free Margin
Margin is the amount you need to open a trade, letting you trade bigger positions. Free Margin is the leftover balance you’ve got for new trades. Keep an eye on your margin to avoid over-leveraging and risking too much.
Pip and lot size
A pip is just the tiniest movement in price. It’s the smallest change you’ll see in a currency pair’s value., while Lot Size refers to the number of currency units traded. Both are important for calculating potential profits and losses. Let’s say the EURUSD pair is trading at 1.1050, and then it moves to 1.1055. That 0.0005 movement is equal to 5 pips.
In summary, proper use of risk management tools like Stop-Loss, Take Profit, and understanding Margin is vital for consistent success in Forex trading.
Let’s walk through an example to explain these terms using math.
Scenario:
- You open a Forex position for EURUSD with the lot size of 1 standard lot (100,000 units of EUR).
- The broker requires a margin of 1% (or 100:1 leverage) to open this position.
Step 1: Calculating Margin: The Margin is the amount required by the broker to open the position. To calculate it:
- Margin = Lot Size × Current Price × Margin Requirement.
Assuming the EUR/USD price is 1.2000:
- Margin = 100,000 × 1.2000 × 1% = 1,200 USD.
So, you need 1,200 USD to open the trade.
2.Balance: The Balance is the amount of money in your account before any trades are opened or closed. Let’s assume your balance is USD 5,000.
3.Used Margin: The Used Margin is the amount of Margin tied up in your open trade. In this case, the Used Margin is 1,200 USD, which was calculated above.
4.Equity: The Equity represents the current value of your account, including profits or losses from your open trades. If the market moves in your favour and the value of your position increases by 200 USD:
- Equity = Balance + Profit/Loss from open trades.
- Equity = 5,000 + 200 = 5,200 USD.
5.Free Margin: The Free Margin is the amount of Margin available for new trades or to absorb potential losses. It is calculated as:
- Free Margin = Equity – Used Margin.
- Free Margin = 5,200 – 1,200 = 4,000 USD.
Summary:
- Balance: 5,000 USD (initial amount in the account).
- Used Margin: 1,200 USD (Margin required for the trade).
- Equity: 5,200 USD (after a profit of 200 USD).
Free Margin: 4,000 USD (available Margin for new trades or to cover losses).
How to use MT5 and Trading view for forex trading
Meta Trader 5 (MT5) and Trading View are key tools for traders. Here’s a simple guide on how to use them.
Getting started with MT5
- Download MT5 from your app store.
- Open it and log in.
- Set up a demo account to practice with.
Linking MT5 to a broker
- Open the app and link it to a broker like Exness.
- Enter your broker’s server and login details.
- If there’s an issue, double-check the server info.
Navigating MT5 for forex trading
- In the Quotes section, you can view and add currency pairs like GBP/USD, USD/JPY, EUR/USD.
- The Chart section shows price movements with candlesticks (red means price is going down, green means it’s going up).
- The Trade section shows your balance, equity, and free margin.
- The Trade History section tracks past trades, profits, and losses.
Placing and closing a trade
- Hit buy or sell to place a trade.
- Pick the currency pair and set your lot size (like 0.01 lots).
- To close a trade, press the position and click “Close Position.”
Understanding lot sizes
- Lot size is how much you’re trading.
- Bigger lot sizes mean bigger potential profits but also bigger risks.
- If you’ve got a small account, use smaller lots to manage your risk.
Using Trading View
Trading View is great for advanced charting and analysis.
- You can customize the candlestick colours and other settings.
- Use it to spot entry points and set stop-loss levels to manage risk.
- Some traders use Trading View for analysis and MT5 for executing trades.
Technical analysis: Charts and candlestick patterns in forex trading
Knowing how to read charts is super important for trading. I’ll explain the different types of charts and how they can help you make trading smarter.
Economic calendar
The economic calendar is key for keeping track of major events that can move currency prices. For example, the Non-Farm Payroll (NFP) report in the US is a big one.
Traders use calendars like Fast to stay on top of real-time events and adjust their strategies as needed.
Fundamental analysis in trading
When you trade based on economic news, that’s called fundamental analysis. By looking at reports like the NFP and other economic data, traders try to predict how these events will affect market trends, especially in the currency markets.
Types of charts in forex trading
Traders use different chart types to help break down market data. The most common ones are:
- Candlestick chart
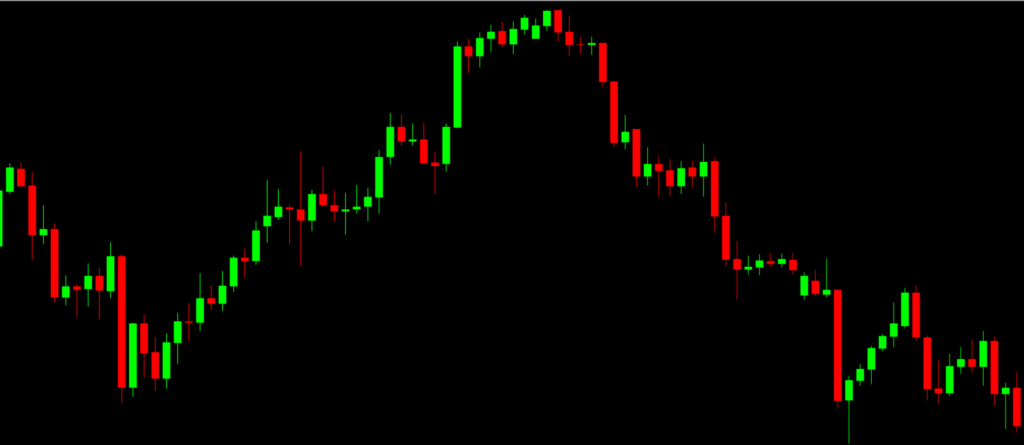
The candlestick chart is the most popular. It shows price movements using open, high, low, and close prices for a specific time period. Candlesticks give a lot of info about market sentiment—like whether the market is bullish (going up) or bearish (going down).
- Line chart
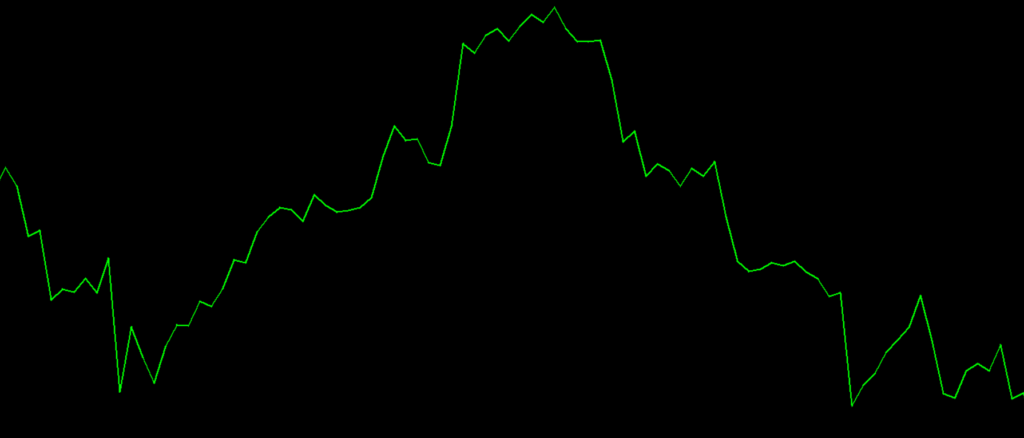
A line chart is simpler. It just connects closing prices with a single line, which makes it less detailed than a candlestick chart.
- Bar chart
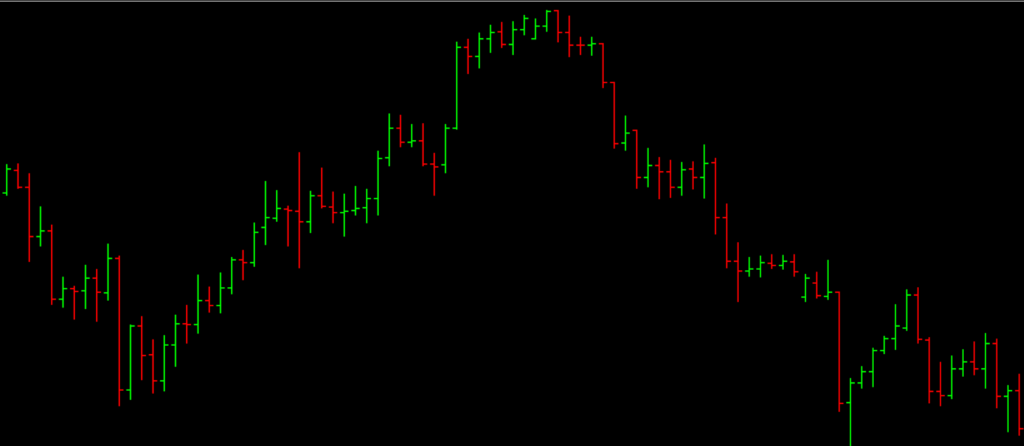
Bar chart is similar to candlestick charts, but they don’t have colour codes to show market sentiment. They show price ranges with vertical bars.
Using forex trading platforms effectively
MT5 (Meta Trader 5) is popular for executing trades and has flexible charting tools.
Trading View is great for analyzing market trends and offers various chart types like candlestick, bar, and line charts. While it’s awesome for analysis, it only links with some brokers, so you can’t always use it for placing trades directly.
Many traders like to use Trading View for chart analysis and MT5 for actually executing their trades.
Combining tools for better decisions
By using the economic calendar, fundamental analysis, and different charting tools, you’ll be able to make more informed trading decisions. Keeping up with market trends with charts like candlesticks and staying updated on important economic events will help you improve your overall strategy.
Understanding candlestick charts in forex trading
Candlestick charts are a go-to tool for forex traders. They help show how prices move over time and can give you a feel for market trends and sentiment. Let’s break it down simply.
Basic candlestick types
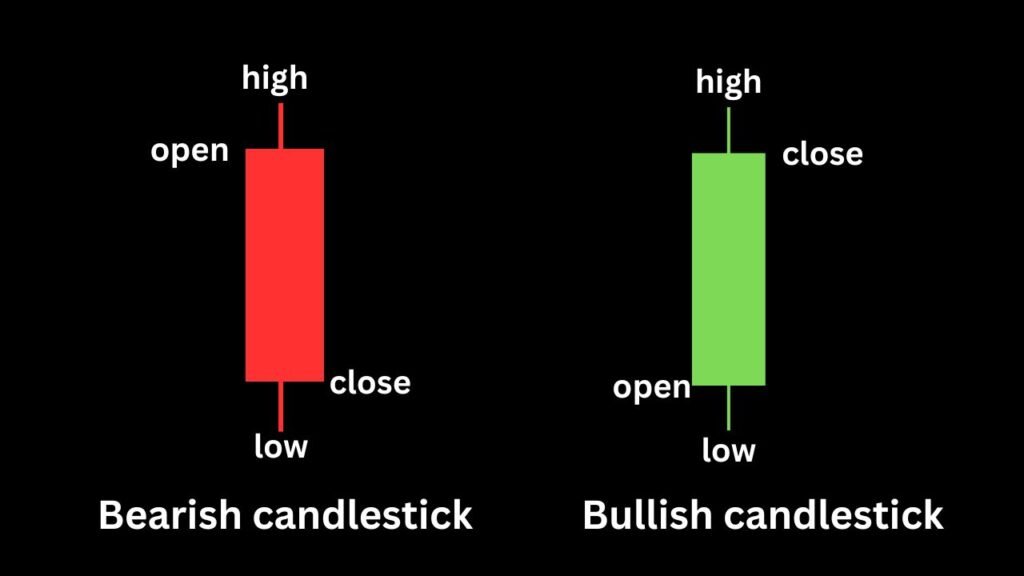
- Bullish Candlestick: This happens when the closing price is higher than the opening price. It shows rising prices and a positive market mood. The body is usually green or blue, and the lines (wicks) show the highest and lowest prices.
- Bearish Candlestick: This occurs when the opening price is higher than the closing price. It signals falling prices and a negative market mood. The body is typically red or grey, with wicks showing the highest and lowest prices.
Key insights from candlestick charts in forex trading
Long Candlesticks: These usually mean strong buying or selling. The market’s moving with a clear direction.
Short Candlesticks: These show less momentum, so the market’s unsure or weak.
Timeframes matter
Timeframes just show how long it takes for a candlestick to form. The one you pick depends on how you like to trade.
- Scalpers: They use very short timeframes like 1-minute (M1) or 5-minute (M5) charts to catch quick price moves.
- Day Traders: They typically use 4-hour (H4) charts to track the day’s price changes.
- Swing Traders: They prefer longer timeframes, like daily (D1) or weekly (W1) charts, to spot bigger trends and hold trades for a longer time.
Candlestick patterns
Knowing candlestick patterns helps you spot potential price moves.
- Bullish Engulfing: A big bullish candle that fully covers a small bearish one. This often signals a price rise.
- Bearish Engulfing: A big bearish candle that completely covers a small bullish one. This usually points to a price drop.
Advanced patterns
- Doji: This has a tiny body and long wicks. It means the market is undecided, often suggesting a reversal when it appears after a strong trend.
- Example: After a downtrend, a Doji could mean buyers are taking over, leading to a reversal.
- Pin Bar (Hammer): A small body at the top with a long wick at the bottom. It shows that buyers pushed prices back up, hinting at a possible trend change.
- Example: A Hammer at the bottom of a downtrend might suggest prices are about to rise.
- Shooting Star: A small body at the bottom with a long wick at the top. It shows buyers pushed prices higher, but sellers took control. This could signal a downturn.
- Example: A Shooting Star after an uptrend may indicate a price drop.
How to use timeframes in forex trading
Each time frame gives a different view of the market:
- Scalpers: Use short timeframes like M1 or M5 to make quick trades.
- Day Traders: Use time frames like H4 to get a bigger picture of the day’s price action.
- Swing Traders: Look at longer time frames like D1 or W1 to spot the overall trend.
By understanding candlestick patterns and timeframes, you can make better trading decisions.
Types of forex trading
In forex trading, there are a few main types of trading strategies:
1. Scalping
Scalping is all about making small profits from quick, frequent trades. Traders focus on very short-term price movements.
- Make many small profits from tiny price moves.
- Focus on trades lasting seconds to minutes.
- Use indicators like moving averages, RSI, and MACD.
- Trade on 1-minute or 5-minute charts.
- Requires speed and quick decision-making.
2. Day trading
A popular type of Trading where all positions are open and close within a single trading day. It’s a good choice for people who enjoy fast-paced action and immediate results. In this Trading, traders aim to capitalize on short-term price movements.
- Open and close positions on the same trading day.
- Avoid holding trades overnight.
- Use both technical and fundamental analysis.
- Use indicators like Bollinger Bands, moving averages, and Fibonacci retracement.
- Trade on 15-minute, 30-minute, or 1-hour charts.
3. Swing trading
Swing trading focuses on capturing medium-term price moves by holding positions for days or weeks. Traders look to ride out price swings.
- Hold positions for several days to weeks.
- Focus on medium-term trends and price swings.
- Always use technical analysis to identify trends and support/resistance levels.
- Use trend lines, candlestick patterns, and oscillators (RSI, Stochastic).
- Requires patience to let trades develop.
4. Position trading
Position trading takes a long-term approach, holding trades for weeks or months based on broad market trends.
- Hold positions for weeks, months, or years.
- Stick to daily or weekly charts to catch the bigger trends.
- Use technical analysis to find the right time to jump in, but let the fundamentals drive your decisions.
- It’s a slow and steady game, so patience is a must!
5. Carry trading
Carry Trading involves borrowing money in low-interest currency and investing it in a high-interest currency to profit from the interest rate difference.
- Borrow in low-interest currencies and invest in high-interest ones.
- Profit from the interest rate differential (carry).
- Focus on long-term trends and global interest rate conditions.
- Commonly trade pairs like the Japanese Yen (low-interest) and Australian Dollar (high-interest).
- Risk management is critical due to exchange rate fluctuations.
How to identify market trends in forex trading
Identifying market trends is key for any trader. A trend shows which way the market is heading, helping you figure out when to jump in (buy) or stay out (sell).
- Uptrend: Prices are going up. In an uptrend, traders look for higher highs and higher lows.
- Downtrend: Prices are going down. In a downtrend, traders watch for lower highs and lower lows.
- Sideways/Range-bound Trend: Prices stay within a set range. Traders look for moves at support or resistance levels.
Understanding changes in trend
Trends don’t last forever, so knowing when a trend is about to change can help you make better trades. Trend reversals usually happen after a long price move, and traders use patterns and indicators to spot these shifts.
- Reversal Patterns: Patterns like Double Top, Head and Shoulders, and Doji candlesticks often hint that a trend is about to change.
- Indicators: Tools like MACD and RSI can help confirm if a trend is losing steam and might be ready to reverse.
Fundamental analysis
Fundamental analysis is all about looking at economic data, news, and events to predict currency price movements. Traders focus on things like interest rates, GDP growth, jobs data, and global events to get a sense of how healthy an economy is.
- Economic Indicators: Keep an eye on things like Non-Farm Payroll (NFP), inflation, and central bank interest rate decisions.
- Impact of News: Big news, like elections or global crises, can really shake up prices.
- Market Sentiment: Watch how the market reacts to news – it can help you find good trading opportunities.
Trading psychology: Avoiding greed and sticking to a plan
Trading is not just about skills – it’s totally about mindset. Market is playing with our psychology. Controlling emotions, especially greed, is very important for success.
- Avoiding Greed: Greed leads to overtrading and risky decisions. Stick to your plan and don’t chase losses.
- Trading Plan: A good plan has clear goals, rules, and strategies. It keeps you focused and disciplined.
- Emotional Control: Stay calm, even when the market is wild. Emotional decisions cause mistakes.
Creating a trading strategy
A trading strategy is your game plan for the market. It helps you stay focused, avoid making quick and impulsive moves.
- Define Your Timeframe: Decide if you’re going for short-term trades (like you love scalping or day trading) or longer-term moves (like swing trading).
- Choose Indicators: Pick tools like RSI, MACD, or Bollinger Bands to help guide your trades.
- Risk Management: Set stop losses, take profits, and control your position sizes based on how much risk you’re willing to take.
- Testing: Before going live, test your strategy with backtesting or demo trading to see if it works.
Example of trading on GBPUSD
Let’s put these concepts into action with a real trading example using GBPUSD, one of the most popular currency pairs.
- Identify the market trend
Check out the GBPUSD on a 4-hour chart. If you see higher highs & higher lows, it’s an uptrend. Look for chances to buy when the price pulls back a bit.
- Look for a trend change
If GBP/USD has been trending up and you spot a bearish reversal pattern, like a Shooting Star, it could mean the uptrend is slowing down, and a drop might be coming.
- Use technical indicators
Use the RSI (Relative Strength Index) to see if the market is overbought or oversold. If the RSI is above 70, GBP/USD might be overbought and could reverse soon.
- Execute the trade
Once you’ve confirmed the trend and reversal, then place your trade. For example, if you think the uptrend is ending, you could sell GBPUSD after spotting the Shooting Star and the overbought RSI.
- Risk management
Always, set a stop loss just below the recent swing low to limit your losses if the trend keeps going up. Then, set a take-profit target at a key support level or use a risk-to-reward ratio, like 1:2, to decide how much you aim to gain.
Final thoughts
Forex trading is one of the biggest, most profitable, and risky businesses around. It can make you a millionaire in just a few years if you stay focused, disciplined and consistent in your trading. With the right strategy and knowledge, you can make money. Stay sharp, keep learning, and manage your risks to succeed in this massive market. Get familiar with key concepts like currency pairs, leverage, and stop-loss orders to manage risk and avoid big losses. Start with a demo account to practice, stay disciplined, and keep learning.
Ready to get started? Open a demo account today and begin practicing your strategy!


