
If you're still using complicated Excel spreadsheets to track your manual backtests, you're spending extra time and making analysis harder than it needs to be. When you're testing a strategy on TradingView or MT5—whether it's an RSI divergence setup or a SuperTrend strategy on Gold—you need a tool that can instantly calculate things like compounding growth, drawdowns, and equity curves.
That's exactly what the TradingBotLab Manual Strategy Backtester is designed to do.

Here's the reality: a trading strategy is only as good as the data you collect. In this step-by-step guide, you'll learn how to record trades, analyze performance, and create verifiable reports without having to deal with spreadsheet formulas.
Step 1: Create a Workspace
First, make sure you're logged into your TradingBotLab account so your data is safely stored and synced to the cloud.
1. Go to Tools > Manual Backtester.

2. Click New Backtest.

3. Now enter your backtest details:
> Name: Give your backtest a specific name (for example, XAUUSD - SuperTrend M15).
> Currency: Choose your base currency (for example, USD).

4. Click Create Workspace and open it to access the main dashboard.

Step 2: Set Up Your Risk Management Rules
Before you log any trades, decide how you want to manage risk. The backtester handles all the calculations for you—you only need to define the rules.
Find the Risk Management section below the main trade entry area.
Choose your preferred calculation method:
1. Percentage (%)
2. Dollars ($)
3. Pips
Set your Risk Percent (for example, 1%) and your Reward Multiplier (for example, 1.5).

Note: The system automatically calculates compounding growth. If a trade loses, it subtracts 1% from the current balance. If a trade wins, it adds 1.5% based on the updated account balance.
Step 3: Record Your Trades from Your Charting Platform
Run your manual backtest on TradingView, MetaTrader, or Binance, and quickly record the results.
Find a valid trade setup on your chart.
In the backtester, choose Buy or Sell. Select Win or Loss. Click to add the trade.
The system immediately updates your account balance, calculates the exact dollar profit or loss for that trade, and adds it to your analytics.
Step 4: Add Time and Date for Better Accuracy
Market activity changes throughout different trading sessions. If you're not tracking the exact time of your trades, you're missing valuable information.
Next to your recorded trades:
Set the Date (Year, Month, Day) to match your historical chart data.
Set the Time (Hour, Minute) to track performance during specific market sessions.

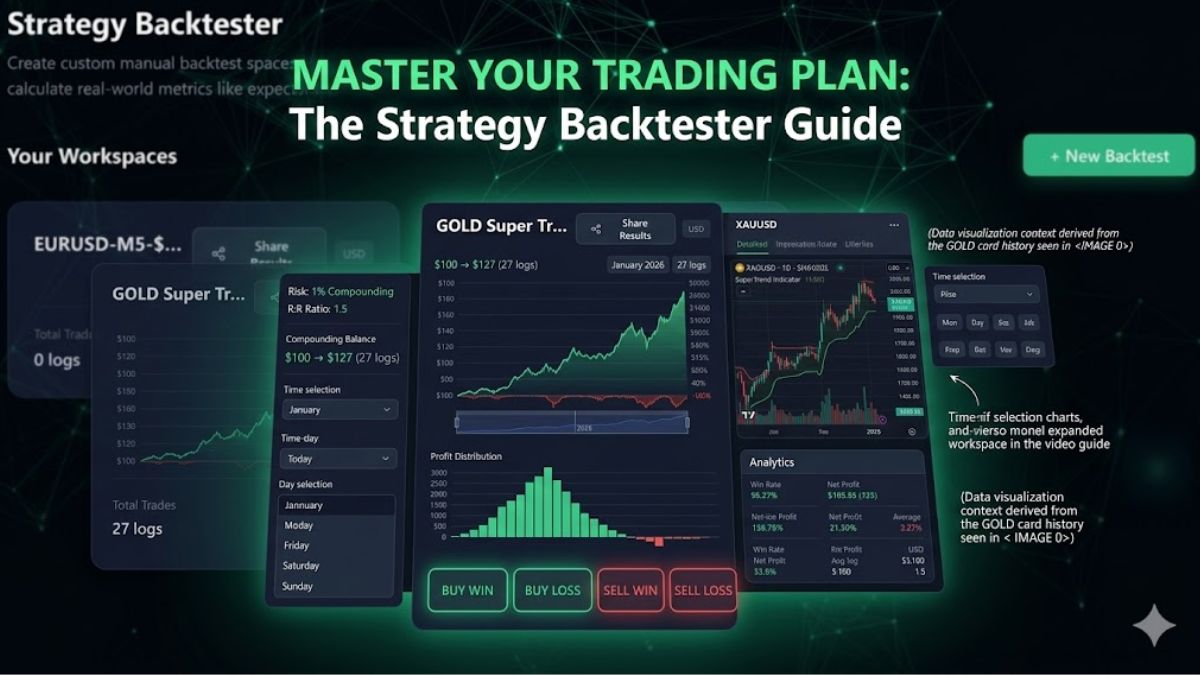
Step 5: Review Your Equity Curve and Drawdowns
Stop guessing your maximum drawdown. As you add trades, the analytics dashboard updates automatically in real time.
Equity Curve
See how your account grows or declines over time through compounding.
Drawdown History
Find out exactly when the strategy experienced its largest drawdowns and how long it took to recover.
Profit Distribution
Review how your trade results are distributed. As you add more trades, your strategy's statistical edge becomes much easier to see.
Key Metrics
Instantly view important statistics, including:
1. Net Profit
2. Total Trades
3. Win Ratio

Step 6: Create a Verifiable Share Link
If you're managing funds, selling a strategy, or showing results to a partner, screenshots aren't enough. You need data that others can verify.
Click the Share icon inside your workspace.

A read-only link will be copied to your clipboard.
Share this link with others. They can view your exact trade history and performance metrics, but they won't be able to edit or change any data.
Final Thoughts
Your testing environment should be just as professional as your trade execution. Stop dealing with custom formulas and broken spreadsheet cells. Use the Manual Strategy Backtester to organize your data and discover your trading edge faster.